


The Clustering Analysis toolbox for cell-class identification
The Clustering Analysis (MATLAB / GNU Octave) toolbox separates cell classes based on the characteristics of extracellularly recorded action potential (AP) waveforms and the properties of the firing pattern. This toolbox was developed and is maintained by Salva Ardid PhD. You can download the matlab code here matlab-files (zipped).
http://accl.psy.vanderbilt.edu/wp-content/uploads/2017/08/clustering_2.png
The code reproduces Figures 3-6 of the paper:
-
Ardid S., Vinck M., Kaping D., Marquez S., Everling S., Womelsdorf T. (2015) Mapping of functionally characterized cell classes onto canonical circuit operations in primate prefrontal cortex.Journal of Neuroscience. [pdf link to come soon, for pre-print please email us].
This toolbox is free but copyrighted by Salva Ardid, and distributed under the terms of the GNU General Public Licence as published by the Free Software Foundation (version 3). Should you find the toolbox interesting, please try it in your data. Just ensure that any publication using this code properly cites the original manuscript and links to this repository: – Ardid, Vinck, Kaping, Marquez, Everling, Womelsdorf (2015) Mapping of functionally characterized cell classes onto canonical circuit operations in primate prefrontal cortex. J. Neurosci. In Press. https://bitbucket.org/sardid/clusteringanalysis Copyright (C) 2014-2015, Salva Ardid.
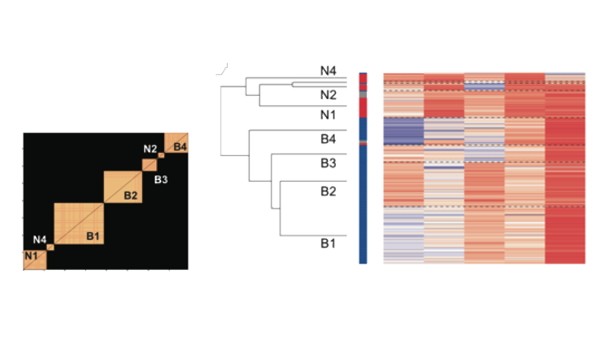
Intro The goal of this code is to identify distinct cell classes based on their electrophysiological features by using unbiased clustering techniques. Thus, for each neuron, we utilized two measures of the action potential waveform (peak to trough duration and time for repolarization – defined as the time in which the voltage of the action potential decays 25% of its amplitude), and measures of its firing properties (mean firing rate, coefficient of variation, Fano factor, as well as local variability measures, such as the local variation and Cv2). A first thing to note is that clustering is sensitive to i) redundant measures, as they duplicate the weight of their variability and bias classification, and to ii) uninformative measures (defined as those that barely contribute to the variability in the dataset) as they basically bring noise and blur classification. So the first step was to preprocess the dataset to standardize the measures, and then prefilter out those measures being redundant or barely informative. This part of the analysis is done by main_prefiltering_analysis.m, and is further explained below. To characterize classes of cells in the dataset, we used the K-means clustering algorithm. A challenge for using K-means is that the number of clusters in which the data splits needs to be known in advance. However, this is precisely what we aim to determine. To estimate then a narrow range in the number of clusters, we used a set of indexes that evaluate the quality of the results from K-means clustering. This part of the analysis is done by main_estimate_numberOfClusters.m. To determine from this narrower range what was the most appropriate number of distinct cell classes, we developed a meta-clustering analysis. In brief, we computed the probability across multiple realizations that different pairs of neurons belonged to a same cluster and used a probability threshold to identify reliable from spurious clusters. This analysis is done by main_pairingOfClusterElements.m. Using such procedure, we found that a K-means clustering with k = 7, in comparison to k = 5-6, was able to identify a larger set of distinct cell classes, whereas, in comparison to k = 8 and above, was still reliable to characterize most of the neurons in the dataset.
This selection was also supported according to Akaike’s and Bayesian criteria. Analysis that was done in main_kmeans_aic_bic.m.
Two scripts are then used to visualize the organization of the resultant cell classes. main_clustering_heatMaps.m generated a heatmap for all the measures of the neurons once they were organized according to cell class. The order of the cell classes was then dependent on the distance between their respective centroids, which was computed by main_dendrogram_clusterCentroids.m. This analysis revealed a hierarchical organization in our dataset, so first cell classes separated in narrow vs broad spiking neurons and inside these two cell types, the different cell classes emerged. Finally, to ensure that all these results were reliable, we developed two validation analysis. First, we repeated the same clustering procedure inside a permutation analysis in which neurons were randomly selected from the dataset (main_validation.m) and compared it to a random assignation of neurons to clusters. Second, we did the same approach but this time separating the neurons in two groups according to the monkey from which they were recorded (main_validation_monkey.m). Both analyses reported a high fidelity with respect to our main clustering procedure. Tutorial for the Clustering Analysis Repository